
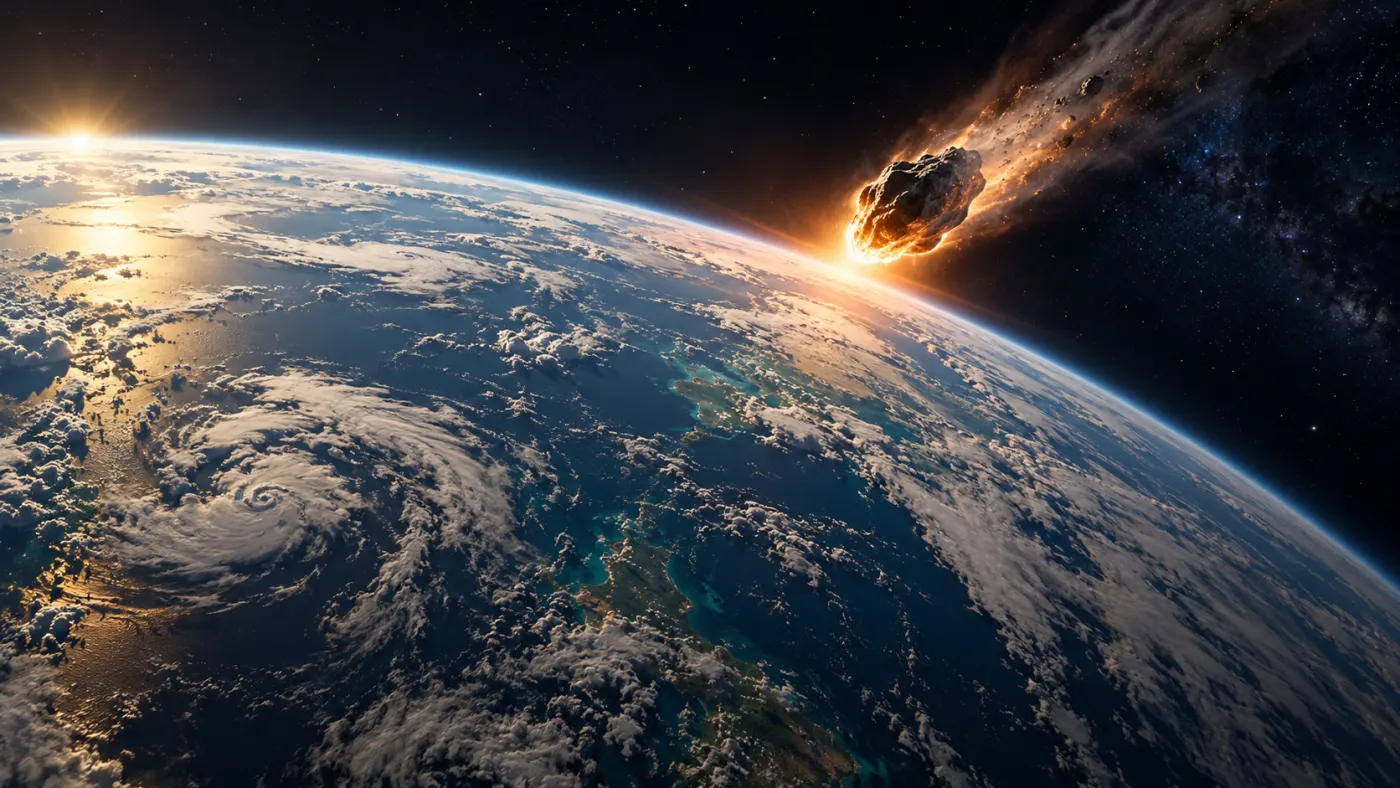
In 2013, a shockwave from a meteoroid flyby shattered windows in the Chelyabinsk area, although no large crater was formed there. Researchers interpret the Samalas eruption of 1257, among other things, from ice core data. Meanwhile, the largest recorded earthquake, in Chile in 1960, was not an explosion. These events share a massive scale, but their effects cannot be fairly ranked by a single number.
Why Explosion Size Doesn't Tell Everything
Energy describes the amount of transformation, while power is energy transferred per unit of time. A sudden release of energy can create a shockwave, which is a rapid change in pressure moving through the air. Overpressure is the difference between the pressure in the wave and the surrounding pressure. Thermal radiation carries energy in the form of electromagnetic waves and can cause burns and fires. Kinetic energy is the energy of motion: it depends on mass and the square of velocity.
The effects also depend on the distance from the source, the height of the explosion, the terrain, the weather, buildings, and the population density. The same energy released over a remote forest and over a densely populated port does not imply the same catastrophe. Casualty figures can be uncertain, and compilations may treat indirect deaths differently, such as from hunger or disease.
TNT, VEI, and the Logarithmic Scale
The TNT equivalent is a unit of energy: one ton of TNT is conventionally equivalent to 4.184 GJ. Kiloton, megaton, gigaton, and teraton correspond to one thousand, one million, one billion, and one trillion tons of TNT, respectively. This does not mean that such an amount of explosive material was used in a given event.
VEI, or the Volcanic Explosivity Index, describes the size of an eruption based on various data, primarily the volume of material ejected. For VEI 6, it is at least about 10 km³, for VEI 7 about 100 km³, and for VEI 8 about 1000 km³. Estimates of deposits depend, among other things, on their behavior, extent, and degree of compaction. VEI is not a measure of energy in TNT and cannot simply be converted to it. USGS explanation.
On a logarithmic scale, equal distances correspond to equal multipliers, not equal differences. This allows for displaying values that differ by thousands or millions of times on one graph, provided that we are comparing the same type of quantity.
Comparison of Scales: What Can Be Compared
The following approximations of energy are arranged in ascending order. The types of events and measurement methods differ: the numbers show energy, not the extent of destruction or the number of casualties. The uncertainty of initial estimates can be significant. For events without a reliable comparable number, we do not enter zero.
| Event | Energy | Type of Estimate |
|---|---|---|
| Beirut | 0.8–1.1 kt TNT | Analysis of waves and remote sensing data; CTBTO |
| Halifax | about 2.9 kt TNT | Explosion energy estimate; Parks Canada |
| Hiroshima | about 15 kt TNT | Nuclear explosion energy; DOE |
| Nagasaki | about 21 kt TNT | Nuclear explosion energy; DOE |
| Chelyabinsk | about 440–500 kt TNT | Estimates of energy released in the atmosphere, in various studies NASA and JPL |
| Tunguska | 3–5 Mt TNT | One model estimate; other models provide different values. NASA |
| Castle Bravo | about 15 Mt TNT | Nuclear test energy; DOE |
| Car Bomba | about 50 Mt TNT | Nuclear test energy; IAEA |
| Chicxulub | 400–4000 Tt TNT | Model estimate of impact energy; NASA NTRS |
Beirut and Hiroshima differ in terms of the type and location of the explosion, and the bolide over Chelyabinsk released energy over a long stretch of the atmosphere. Therefore, the ratio of numbers does not imply the same ratio of destruction. Energy also does not indicate how many people were exposed to the wave, radiation, or fallout.
Eruptions: Separate VEI Scale
Mount St. Helens in 1980, Krakatau in 1883, and Tambora in 1815 are classified by the USGS as VEI 5, 6, and 7, respectively. A one-step transition corresponds approximately to a tenfold threshold of the volume of ejected material. This is not a tenfold increase in energy in TNT. USGS comparison.
Other Events: No Ranking in Energy
We describe them separately because we do not have comparable energy estimates for them. VEI, crater size, number of casualties, and earthquake magnitude answer different questions and do not create a single order from smallest to largest.
Oppau
Date: 1921-09-21.
On September 21, 1921, a fertilizer warehouse containing ammonium nitrate and ammonium sulfate exploded at the BASF plant in Oppau. The caked material was loosened using blasting work; on that day, catastrophic explosions occurred, damaging the plant and the surrounding area.
BASF reports over 500 fatalities and about 2000 injuries. Other compilations may use different counting criteria or be based on later findings. The destruction affected the plant and neighboring towns; after the tragedy, aid for the victims was initiated.
The course of the event is reconstructed from plant documentation, accounts, and analyses of the fertilizer's properties. The mere fact that a given method of breaking up caked material had been used previously did not guarantee that each subsequent batch would have identical properties.
Sources: www.basf.com; www.ffi.no.
Texas City
Date: 1947-04-16.
On April 16, 1947, at the Texas City port, ammonium nitrate fertilizer was being loaded onto the ship Grandcamp. Heat, smoke, and fire were noticed in the hold. Attempts to control the fire failed, and the cargo exploded, destroying a significant part of the port and a nearby chemical plant.
The first explosion killed over 500 people and injured thousands, according to the US Army Corps of Engineers. Debris and fires caused further destruction. Another ship, the High Flyer, was also threatened and later exploded. The scale of the losses resulted from the combination of materials in the port, fires, and the presence of people nearby.
We know the sequence of the fire, explosion, and rescue operation from service documentation and accounts. Differences in casualty figures in sources require caution: some compilations refer to the first explosion, while others encompass the entire disaster and its aftermath.
Sources: www.usace.army.mil; www.tsl.texas.gov.
Port Chicago
Date: 1944-07-17.
On July 17, 1944, ammunition was being loaded onto ships at the California naval port. A series of explosions destroyed the dock and vessels moored there. 320 sailors and civilians were killed, and about 400 people were injured. This number should not be confused with the energy of the explosion: we do not provide a reliable comparable energy estimate.
Most of the dead were Black sailors, who were assigned dangerous loading tasks in a segregated navy. After the disaster, some sailors refused to return to work out of safety concerns. Fifty were charged with mutiny. The history of the tragedy and the trial became part of a broader debate about segregation in the U.S. armed forces.
The course of work and post-war proceedings are known from navy documents and court records. The National Park Service preserves the memory of the victims at the disaster site; uncertainty regarding the exact cause of ignition does not disappear simply because the destruction has been well documented.
Sources: www.nps.gov; home.nps.gov; home.nps.gov.
Manicouagan
Date: about 212 million years ago.
An ancient impact of a cosmic object created the Manicouagan structure in present-day Quebec. NASA cites an age of about 212 million years; different publications may provide slightly different datings. Long-term erosion and subsequent processes have altered the original crater.
The visible ring of water today is not a simple measure of the original crater diameter. NASA describes about 70 km for the preserved structure surrounded by a ring lake and estimates the original diameter at about 100 km. These are two different sizes, not conflicting measurements of the same edge.
The rocks contain traces of transformations caused by the shock, and the shape of the structure is also studied from space. Dating and models help reconstruct the event, but do not allow for directly stating the number of casualties or the exact energy.
Sources: earthobservatory.nasa.gov; www.usgs.gov.
Sudbury
Date: about 1.85 billion years ago.
About 1.85 billion years ago, a large impact occurred in the area of present-day Ontario. The Sudbury structure was formed, whose rocks have since been deformed and altered by a very long geological history. It does not look like a fresh, round crater today.
NASA describes the preserved structure as elongated and states that the original diameter may have reached about 200 km. This is a reconstruction of the original size, not a measurement of the existing round edge. The effects on life and the exact energy are not known in a way that allows them to be placed in a simple ranking.
Impact origin is evidenced by characteristic changes in rocks due to strong shock. Studies of rocks and dating allow estimating the age and reconstructing the subsequent stages of transformations.
Sources: ares.jsc.nasa.gov; earthobservatory.nasa.gov.
Vredefort
Date: about 2 billion years ago.
About two billion years ago, a large cosmic impact occurred in the area of present-day South Africa. The Vredefort structure remains from it. Since then, erosion has removed and exposed significant portions of rocks, so today's landscape is not an accurate representation of a fresh crater.
NASA describes exposed rocks that were deep below the surface before the impact. The size of the original structure is reconstructed based on geology and modeling, and its result depends on the definition of the crater boundary adopted. We do not assign it arbitrary TNT energy.
Geologists analyze the structure of rocks, minerals altered by the shock, and the age of materials related to the impact. The older and more eroded the structure, the more interpretation of the incomplete geological record plays a role.
Sources: science.nasa.gov; science.nasa.gov.
Mount St. Helens
Date: 1980-05-18.
On May 18, 1980, after an earthquake, the northern slope of Mount St. Helens in Washington collapsed. The sudden unloading allowed for a violent lateral explosion. This was followed by a high column of ash, and melting snow and ice fueled lahars.
USGS reports 57 fatalities. The blast knocked down forests to the north of the mountain, and ash was carried far by the wind. Prior monitoring and closures of parts of the area reduced the number of people exposed, but did not eliminate the threat.
The sequence of the landslide and eruption is known from observations, photographs, seismographs, and sediment mapping. USGS classifies the eruption as VEI 5; this classification is not a measurement of bomb energy.
Sources: pubs.usgs.gov; pubs.usgs.gov.
Laki
Date: 1783–1784.
In 1783, the fissure system Lakagígar, known as Laki, opened in Iceland. For many months, lava flowed and gases were released. The event was not limited to a single explosion: it was a prolonged volcanic crisis.
The gases and deposits affected the environment and livestock in Iceland. Contamination of pastures and livestock losses contributed to a severe food crisis. The pollution cloud was also recorded in other parts of Europe; the scale of the effects depended on the location and time.
Scientists combine historical accounts with lava mapping and rock analysis. Smithsonian cites an estimate of about 14.7 km³ of lava; this is the volume of lava that should not be equated with the volume of ash or converted to TNT.
Sources: volcano.si.edu.
Novarupta
Date: 1912-06-06.
In June 1912, Novarupta erupted in Alaska. Ash eruptions and pyroclastic flows filled an area later named the Valley of Ten Thousand Smokes. The eruption also caused ash fallout and disruptions for nearby communities.
During the eruption, the Katmai caldera collapsed, although the Novarupta vent is located about 10 km away. The apparent contradiction arises from connections in the magma system: the place of drainage and the place of collapse do not have to be identical. Smithsonian classifies the event as VEI 6.
Details are known from observations in 1912 and later mapping of ash, flows, and the caldera. The VEI index is a classification based on eruption products, not a reading of energy from a single meter.
Sources: volcano.si.edu.
Pinatubo
Date: 1991.
In June 1991, Pinatubo erupted in the Philippines. Ash, pyroclastic flows, and later lahars threatened nearby communities. Rain mixed with ash, increasing the load on roofs and transporting sediments down river valleys.
The eruption released sulfur dioxide into the stratosphere. The resulting aerosols reflected some sunlight and contributed to temporary cooling of the Earth's surface. Warning actions and evacuations before the peak limited human losses, although the effects of the disaster lasted longer than the eruption itself.
Scientists study sediments, accounts, and atmospheric measurements. They distinguish the amount of rock ejected from the amount of gases: two eruptions with similar VEI may have different impacts on the atmosphere.
Sources: volcano.si.edu; www.usgs.gov.
Krakatau
Date: 1883.
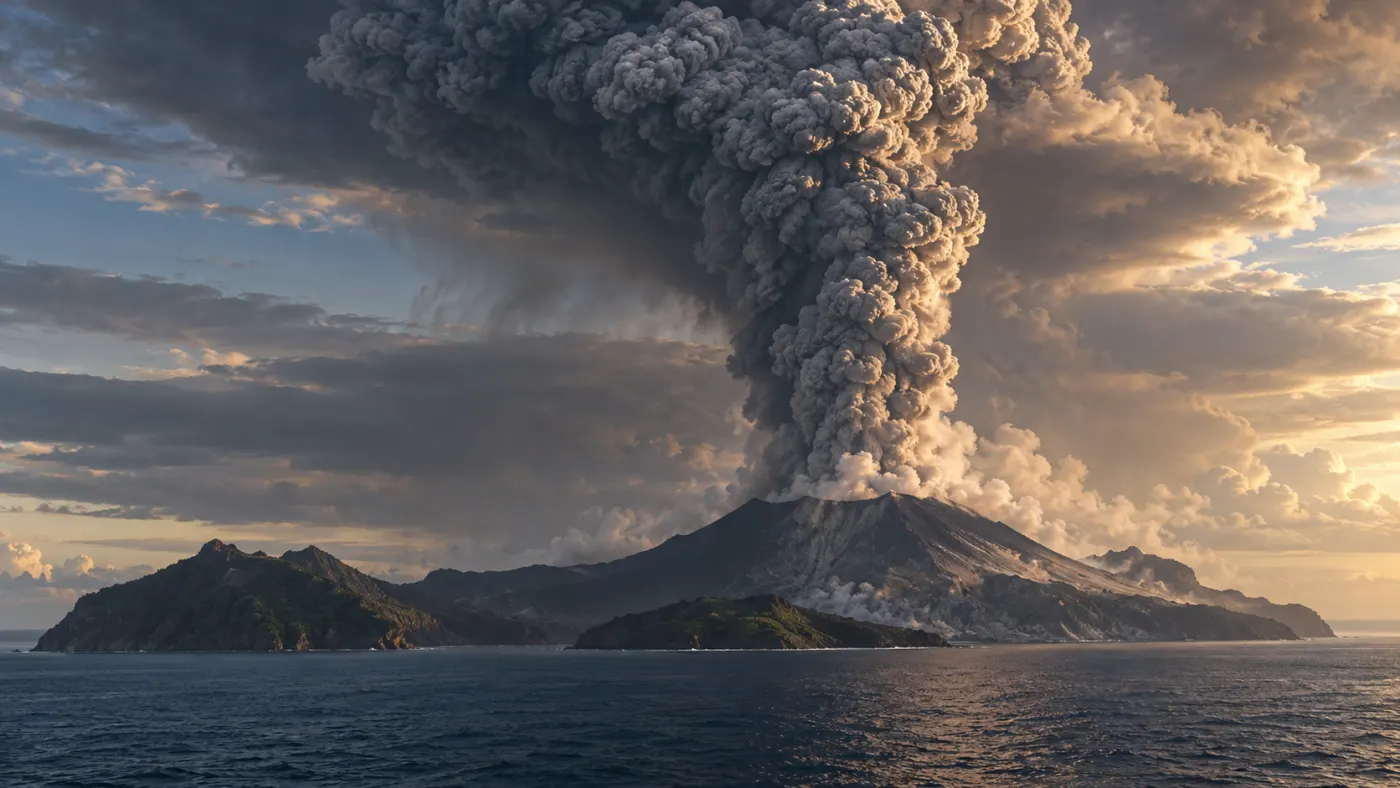
In 1883, Krakatau, located in the Sunda Strait between Java and Sumatra, experienced a series of violent eruptions. The collapse of parts of the volcanic complex and the movement of material into the sea contributed to a tsunami that struck nearby coasts. Ash and hot pyroclastic flows were also threats.
USGS estimates about 36,000 and 36,417 casualties, indicating the tsunami as the main cause of death. Such numbers depend on sources and counting methods; they are not an accurate tally of all the consequences of the disaster. Waves were recorded far from the volcano.
Reports of the eruption come from historical documents, sea level records, and geological studies. USGS provides a VEI of 6. This is an index of eruption size based on its products and observations, not a number of megatons of TNT.
Sources: www.usgs.gov; pubs.usgs.gov; pubs.usgs.gov.
Tambora
Date: 1815.
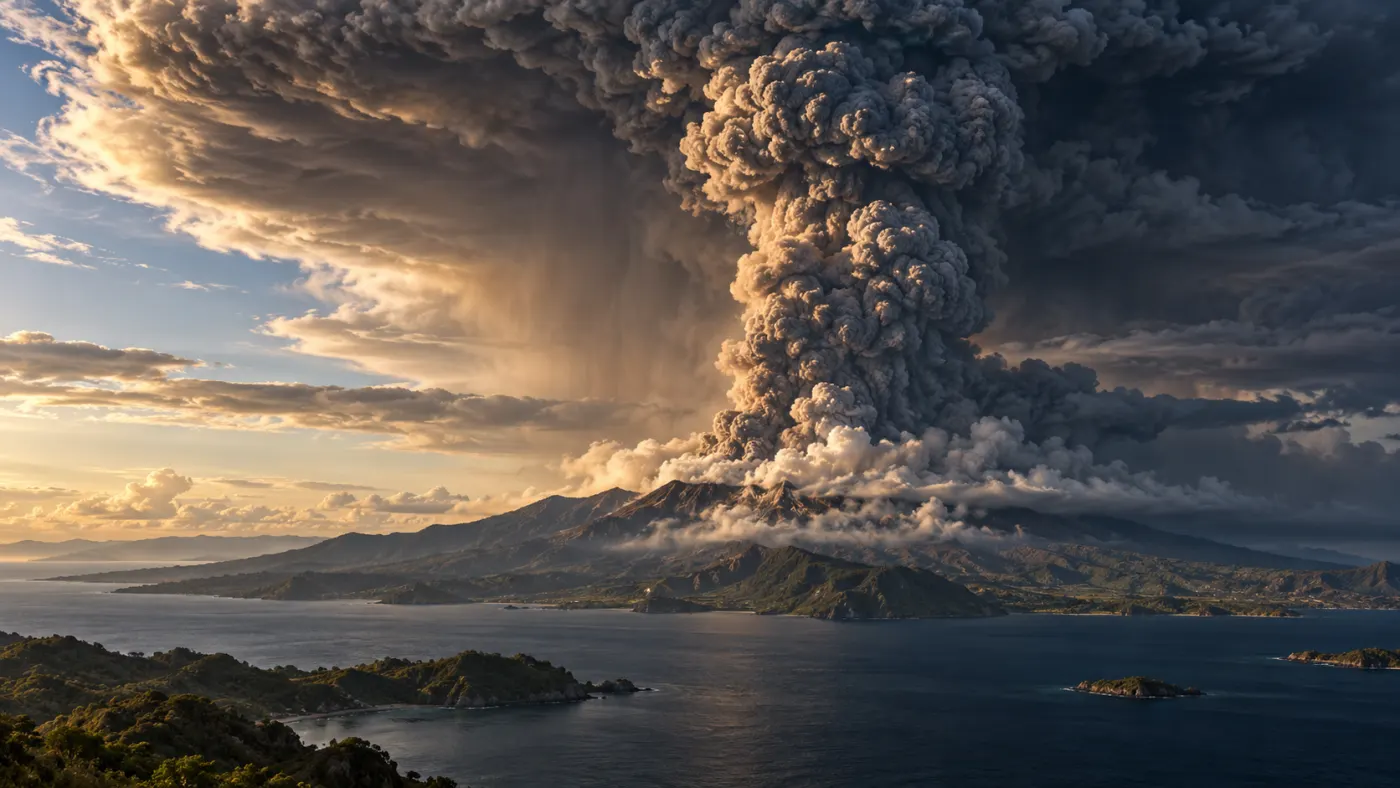
In April 1815, Tambora on Sumbawa Island in Indonesia ejected huge amounts of ash, pumice, and gases. Hot pyroclastic flows and material fallout destroyed the areas around the volcano. After the eruption, a caldera remained, which is a depression associated with the collapse of the roof over a partially emptied magma system.
The effects reached far beyond Indonesia. Sulfur gases in the stratosphere contributed to the formation of aerosols that reflected some sunlight. In 1816, parts of Europe and North America experienced cool weather and crop problems. It is referred to as the year without a summer, but local weather and crop failures also had other regional causes.
Researchers link eruption deposits with historical records and traces of sulfates in ice. USGS classifies Tambora as VEI 7. The VEI comparison with Krakatau describes the size of the eruption, not a simple conversion to TNT energy.
Sources: volcano.si.edu; www.usgs.gov; pubs.usgs.gov.
Samalas
Date: 1257.
In 1257, Samalas on the Indonesian island of Lombok experienced a massive eruption. Violent columns of ash and pyroclastic flows left extensive deposits, and a caldera formed after part of the magma system was emptied. The historical death toll is not known with the same certainty as in well-documented modern disasters.
For years, researchers have seen a strong signal of sulfates from the mid-13th century in ice cores from Greenland and Antarctica, but they sought its source. A combination of sediment studies on Lombok, the composition of volcanic glass, and historical records pointed to Samalas as the cause of the massive eruption.
An ice core is an archive of atmospheric precipitation: layers can be dated and chemically analyzed. The sulfur signal alone does not automatically indicate the name of the volcano or the exact weather patterns. Therefore, researchers correlate it with geology, tree rings, and documents, keeping in mind the limitations of each method.
Sources: www.nature.com; www.nature.com.
Hunga Tonga–Hunga Haʻapai
Date: 2022-01-15.
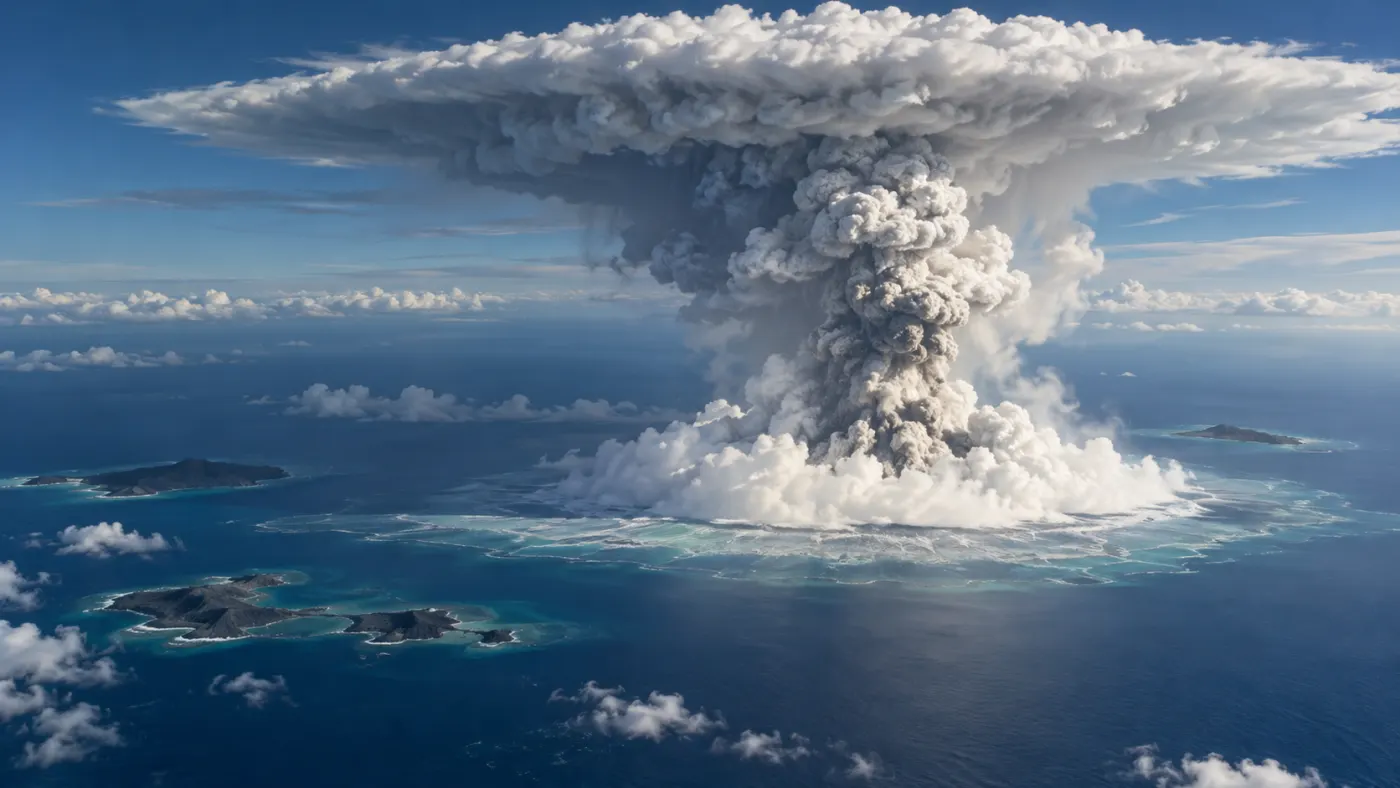
On January 15, 2022, the underwater volcano Hunga Tonga–Hunga Haʻapai produced a powerful eruption column. The explosion destroyed a significant portion of the volcanic island, and a tsunami struck the coasts of Tonga and traveled across the Pacific. The USGS describes both waves generated by the displacement of water and waves associated with atmospheric pressure disturbances.
Satellites and atmospheric instruments observed an exceptionally large influx of water vapor into the stratosphere. The height of the cloud alone is not sufficient to determine the VEI or calculate the energy in TNT. The phenomenon serves as a reminder that different eruptions can affect the atmosphere in various ways.
The event's progression was reconstructed from satellite images, tide gauges, pressure wave records, and field measurements. Each instrument observes a different part of the phenomenon; a combined analysis helps explain why the tsunami also spread along atypical paths.
Sources: www.usgs.gov; www.jpl.nasa.gov.
Toba
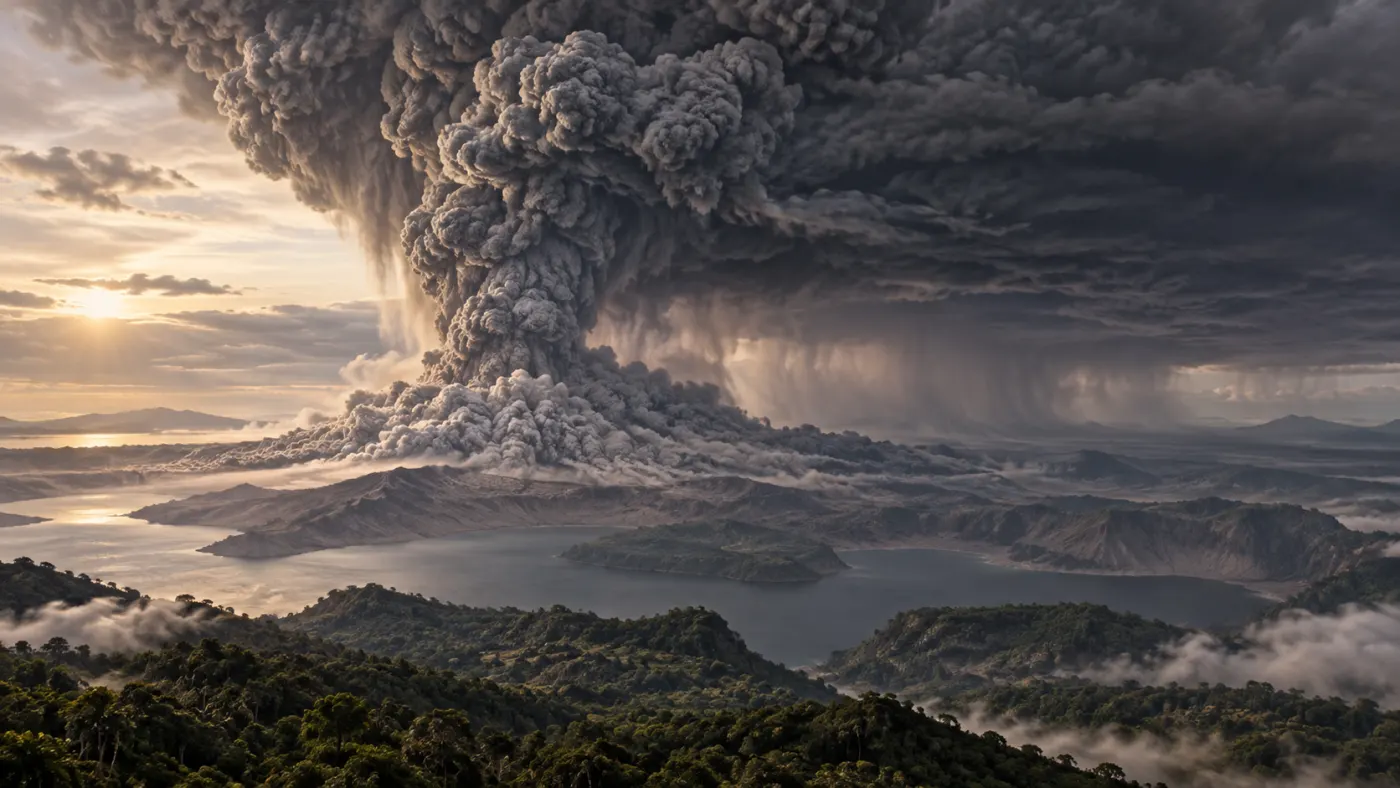
Date: approximately 74,000 years ago.
About 74,000 years ago, a massive eruption occurred in the Toba region of Sumatra. Extensive layers of ash and volcanic rocks are its geological trace. A caldera formed, now occupied by Lake Toba; this does not mean that the shape of today's lake is an exact representation of the eruption's progression.
The USGS estimates the volume at about 2800 km³ in terms of dense rock equivalent (DRE). This is not the same method of calculation as the volume of loose ash in the sediment. The eruption may have affected the climate, but its effects varied regionally.
The hypothesis that Toba nearly led humanity to extinction is debated and is not an established fact. Scientists compare sediment dating, archaeological data, and climate data, but each type of material has spatial and temporal limitations.
Sources: www.usgs.gov; www.usgs.gov.
Ancient Yellowstone Eruptions
Date: approximately 2.08 million, 1.3 million, and 631,000 years ago.
In the Yellowstone area, several very large eruptions occurred in the past, creating calderas. The material ejected left deposits that allow for the recognition of the extent of the events. The USGS reports three major episodes from about 2.08 million, 1.3 million, and 631,000 years ago; different studies round the dates.
The popular claim that another supereruption is overdue does not stem from this data. The two intervals between the three events do not allow for the establishment of a regular cycle. It is unknown when the next eruption will occur or whether it will be large.
Geologists study ash and rock layers and date volcanic materials. Current changes are monitored using seismographs and ground deformation measurements. Monitoring can detect concerning changes, but it does not provide a calendar for future eruptions.
Sources: www.usgs.gov; www.usgs.gov.
La Garita and Fish Canyon Tuff
Date: approximately 27.8 million years ago.
About 27.8 million years ago, a massive eruption occurred in what is now Colorado, associated with the La Garita caldera. Pyroclastic flow deposits formed the Fish Canyon Tuff, an extensive rock unit still studied today.
The USGS describes the volume of tuff exceeding 5000 km³ as an estimate based on preserved and reconstructed deposits. This is the volume of material, not the energy of the explosion in TNT. Since such an ancient event, erosion and geological processes have altered the landscape.
Geologists combine sediment mapping, rock composition analysis, and dating. Since there were no human records or instrument measurements, the detailed course and effects can only be reconstructed indirectly, with appropriate uncertainty.
Sources: www.usgs.gov.
Chile Earthquake
Date: 1960-05-22.
On May 22, 1960, southern Chile was struck by a massive earthquake in the subduction zone. The displacement of the ocean floor triggered a tsunami that hit the Chilean coast and crossed the Pacific. This was a tectonic event, not an explosion.
The USGS reports a magnitude of Mw 9.5 and describes it as the largest instrumentally recorded earthquake. The waves caused casualties in Hawaii and Japan as well. Sources differ in estimates of the total number of deaths; it is important whether they count only Chile, other countries, and indirect deaths.
Seismographs recorded the shock, and the height and extent of the waves are reconstructed from tide gauges, field traces, and accounts. Magnitude describes the size of the earthquake by a different method than the TNT equivalent of an explosion and does not itself indicate the number of casualties.
Sources: pubs.usgs.gov; www.usgs.gov.
Indian Ocean Earthquake and Tsunami
Date: 2004-12-26.
On December 26, 2004, a strong earthquake at the plate boundary near Sumatra violently displaced the seabed. Water surged in a series of tsunami waves that reached the shores of the Indian Ocean. It was not an explosion, so the magnitudes of the earthquake are not placed on the energy bomb chart.
NOAA reports 227,899 people killed or missing and presumed dead due to the earthquake and tsunami. In many places, the waves arrived shortly after the shock, making it difficult to separate the casualties of the two phenomena. The effects also included displacements and the destruction of homes and livelihoods.
We know about the event's progression from seismographic records, tide gauges, field observations, and accounts. The development of warning systems after the tragedy does not eliminate the threat but helps detect waves and communicate warnings to communities in their path.
Sources: www.ncei.noaa.gov; www.noaa.gov.
Theia Hypothetical Collision
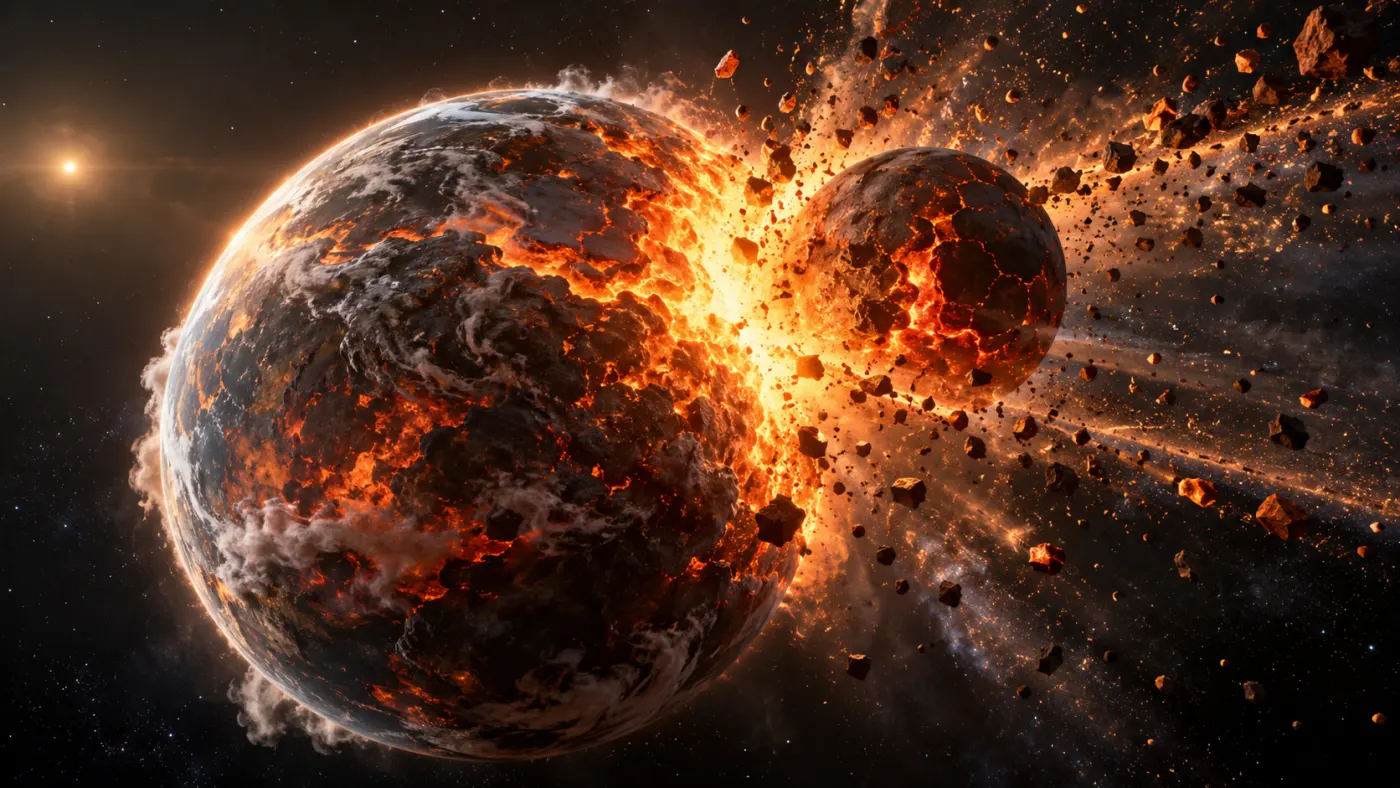
Date: approximately 4.5 billion years ago.
According to one of the main hypotheses for the formation of the Moon, very young Earth collided with a large body called Theia. The material ejected during the collision was then thought to form the Moon. We did not observe this event: its timing, exact course, Theia's composition, and the way the satellite formed are being reconstructed.
Such a large collision would involve a planet very different from today's Earth. There is no basis for providing a number of human casualties or treating the artistic illustration as a photograph of the event. Hypotheses are not ranked alongside documented historical explosions.
Scientists compare the composition and isotopes of lunar and terrestrial rocks, analyze the motion of the Earth-Moon system, and create computer models of the collision. No single model is a direct record of the past. Different scenarios must explain the similarities of rocks and other available observations.
Sources: science.nasa.gov; science.nasa.gov.
Energy Ranking: From 9th Place to 1st Place
The numbering refers only to the nine events listed in the energy table above, not all known disasters. This is an approximate order: estimates come from various methods and do not specify the number of casualties or the extent of destruction. For example, different models of the Tunguska event provide a wider range of energy that may include the energy of Castle Bravo. The hypothetical collision of Theia remains outside the ranking, as its exact course and energy are unknown.
9th Place: Beirut
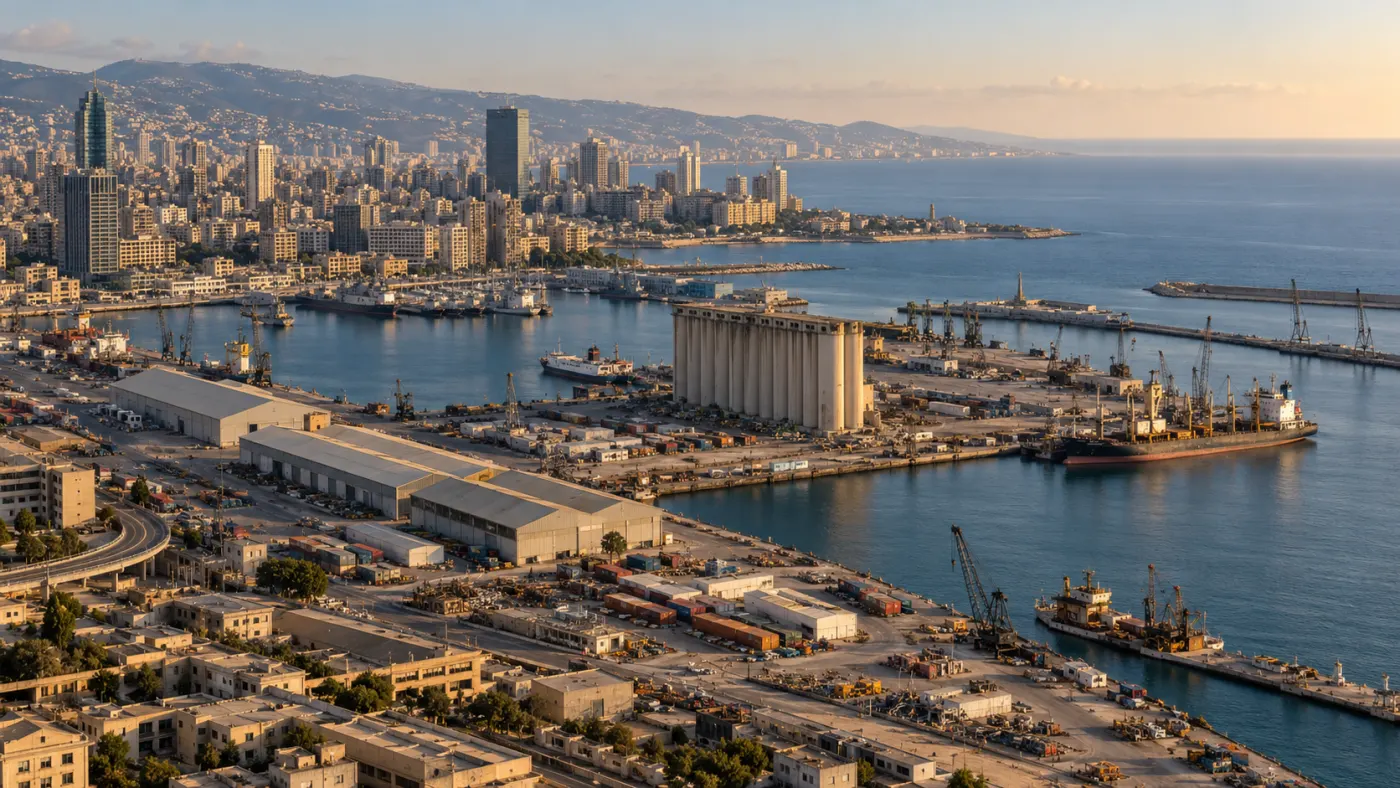
Date: 2020-08-04.
On August 4, 2020, a fire at the port of Beirut preceded a massive explosion of stored ammonium nitrate. The shockwave swept through the city, destroying the port and damaging buildings and windows far beyond its borders. CTBTO's conference analysis describes over 200 dead and thousands injured.
One analysis estimated the energy at 0.8–1.1 kt TNT. This is not the mass of the stored fertilizer: the same study reported about 2750 tons of ammonium nitrate as the reported amount of material. The conditions of the fire, storage, and the course of investigations are important for understanding the causes; the name of the substance alone does not explain every detail of the disaster.
The authors of the analysis combined seismic, infrasonic, and hydroacoustic signals with radar data. The resulting range is a model estimate, not a direct measurement of total energy. Recordings, port documents, and damage inspections are separate sources of information about the event's course.
Sources: conferences.ctbto.org.
8th Place: Halifax
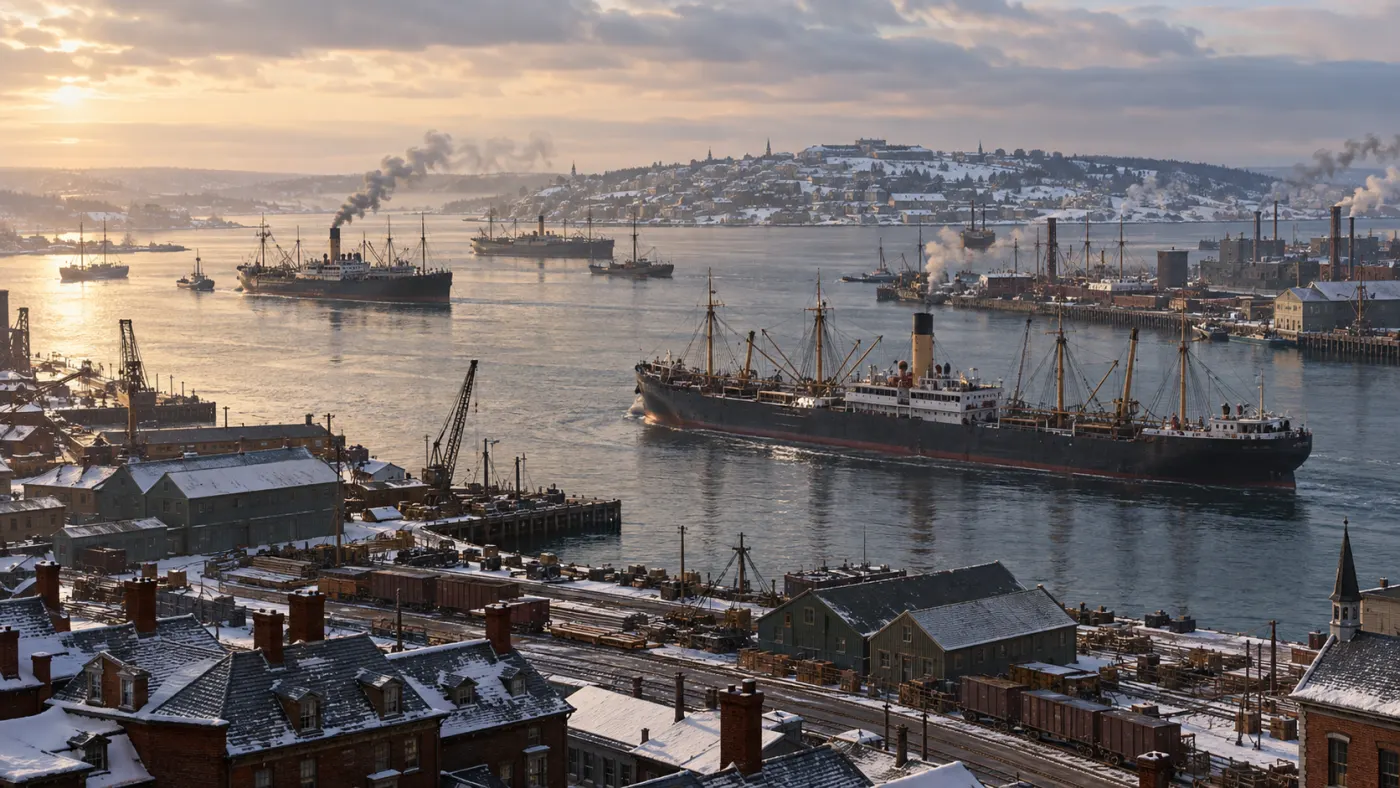
Date: 1917-12-06.
On December 6, 1917, in the port of Halifax, the French ship Mont-Blanc carrying explosives collided with the Norwegian Imo. A fire broke out on the Mont-Blanc. The burning ship drifted towards the shore, and its crew abandoned the vessel; many observers were unaware of the dangerous cargo.
The explosion destroyed homes in nearby neighborhoods, caused fires, and created a wave in the harbor. Parks Canada reports about 2000 dead and thousands injured. Many people watching the fire through windows suffered eye injuries from shattered glass. Parks Canada estimates the energy of the explosion at about 2.9 kt TNT, less than that of the bombs dropped on Hiroshima and Nagasaki. After the disaster, aid poured in from Canada and abroad, and the city was rebuilt.
The sequence of events is known from records, accounts, and port documentation. The scale of eye injuries influenced the development of care for blind individuals. This serves as a reminder that a visible fire can precede a shockwave, and its effects depend on distance and building structures.
Sources: Parks Canada, the course of the disaster; Parks Canada, energy estimate.
7th Place: Hiroshima
Date: 1945-08-06.
On August 6, 1945, the United States dropped an atomic bomb on Hiroshima. The airburst created a shockwave, intense thermal radiation, and ionizing radiation. Fires and building collapses exacerbated the effects of the attack.
The U.S. Department of Energy estimates the bomb's energy at about 15 kt TNT. Many people died instantly, while others later succumbed to injuries and radiation exposure. Total estimates depend on the time period in question and incomplete data on the population present in the city.
Data comes from military documentation, medical studies, testimonies, and damage analyses. Survivors faced health and social consequences for years; the energy of the explosion does not describe the full extent of the disaster.
Sources: www.energy.gov; www.atomicarchive.com.
6th Place: Nagasaki
Date: 1945-08-09.
On August 9, 1945, the United States dropped a second atomic bomb on Nagasaki. The airburst caused a shockwave, fires, and radiation exposure. The terrain and the location of the detonation influenced the distribution of destruction in the city.
The U.S. Department of Energy estimates the bomb's energy at about 21 kt TNT. Although this is more than the reported 15 kt for Hiroshima, the extent and nature of the destruction are not a simple replication of that event. Factors such as topography and the distance of people and buildings from the explosion site were significant.
We know about the casualties and effects from accounts, medical documents, field studies, and historical analyses. Estimates of deaths vary depending on the time period considered and the method of accounting for those who died later.
Sources: www.energy.gov; atomicarchive.com.
5th Place: Chelyabinsk
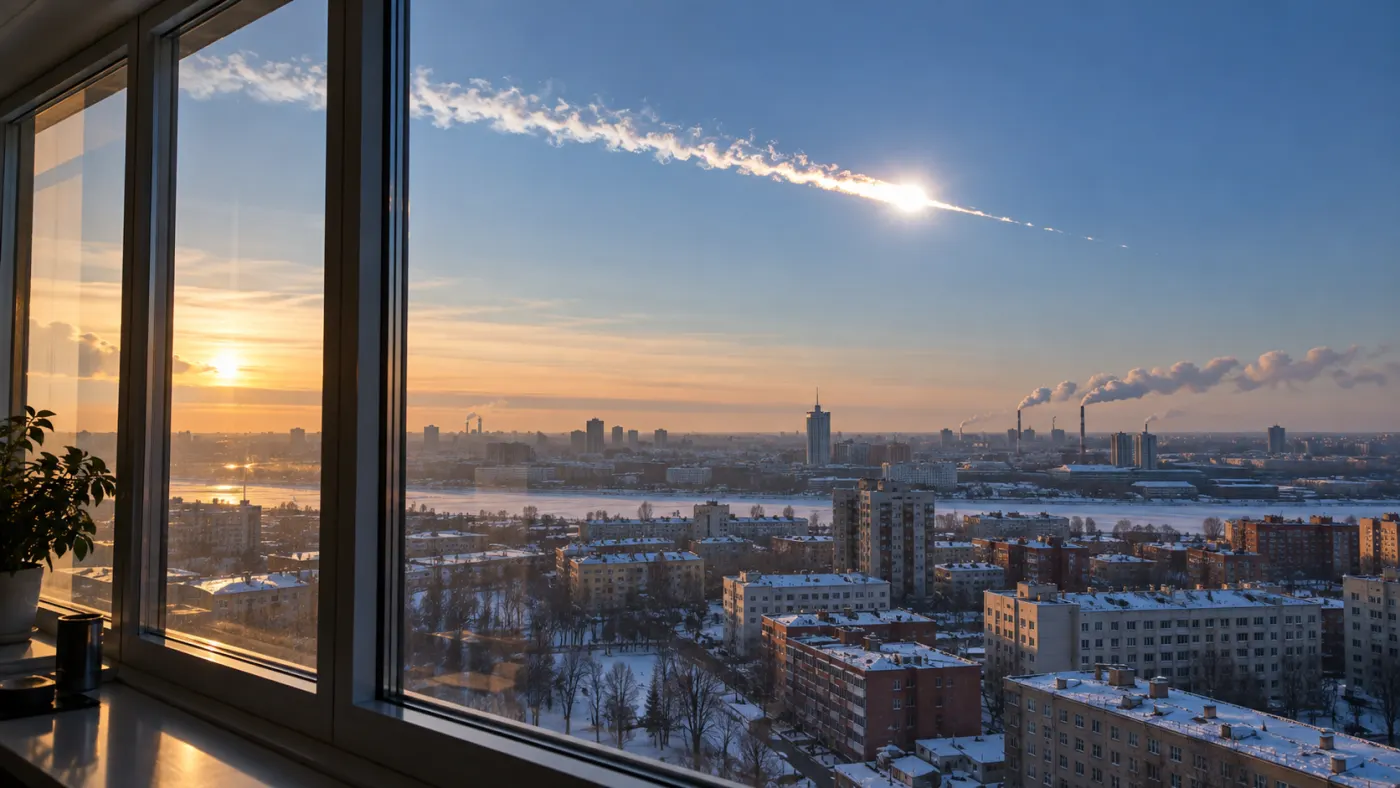
Date: 2013-02-15.
On February 15, 2013, an object comparable in size to a house entered the atmosphere over the Chelyabinsk region. It disintegrated high above the ground; the bright flash reached observers before the shockwave. When the wave reached buildings, it shattered windows and damaged structures. Many people were injured by glass, also because they were looking towards the sky or windows.
NASA reports various estimates of about 440 kt and around 500 kt TNT. These are approximations of the energy released during atmospheric entry, not precise values down to the last kiloton. Sources also differ in the number of injured and the extent of included localities: NASA reported over 1600 injured in 2018.
The flight was recorded by car cameras and monitoring, and infrasound and other signals were captured by stations worldwide. Meteorites were also found. The combination of observations and models allows for estimating the trajectory and energy, although the result depends on the assumptions made.
Sources: www.nasa.gov; www.jpl.nasa.gov; ntrs.nasa.gov.
4th Place: Tunguska
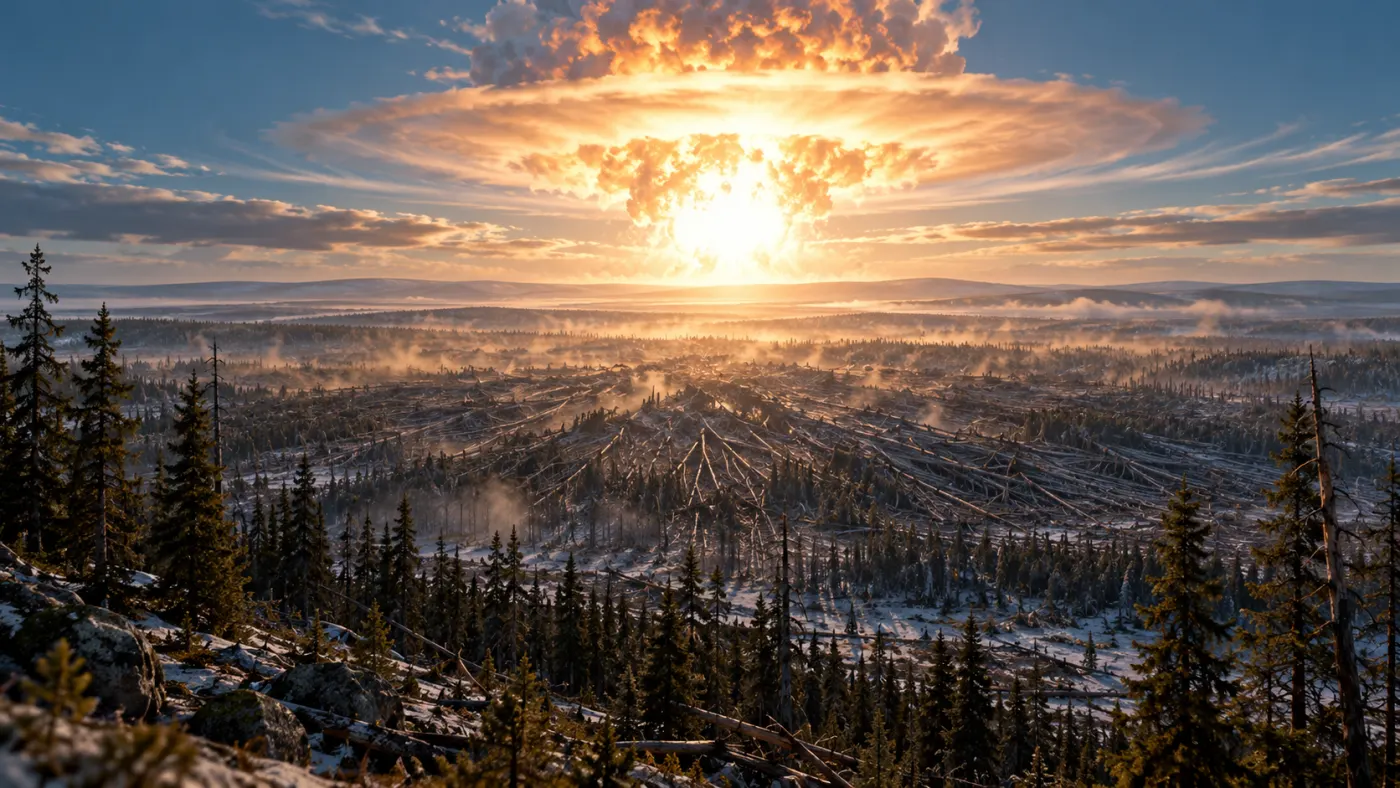
Date: 1908-06-30.
On June 30, 1908, a very bright object appeared over the Siberian taiga. A violent release of energy occurred in the atmosphere, creating a shockwave. Studies of fallen trees indicate an area of about 2150 km². This was a sparsely populated area, but this did not mean a lack of local losses: NASA describes, among other things, the death of reindeer.
No typical large crater was found at the site. The most commonly accepted explanation suggests the disintegration of a small celestial body in the atmosphere. The exact size, composition, and energy remain subjects of modeling. One analysis described by NASA reported 3–5 Mt TNT; this is not a direct measurement made at the source.
Expeditions reached the site only years later. Scientists use the arrangement of fallen trees, seismic and barometric records, and models. The absence of a crater does not prove that nothing from space arrived, but it complicates the determination of all details.
Sources: www.nasa.gov; ntrs.nasa.gov; science.nasa.gov.
3rd Place: Castle Bravo
Date: 1954-03-01.
On March 1, 1954, the United States conducted the thermonuclear test Castle Bravo at Bikini Atoll. Instead of the expected approximately 6 Mt, about 15 Mt TNT was achieved. This is an estimate of the explosion's energy, not the amount of TNT actually used. The difference meant significantly more severe consequences than anticipated in the test plan.
With the wind, radioactive fallout reached beyond the designated danger zone. It exposed residents of the Marshall Islands, test participants, and the crew of the Japanese fishing boat Lucky Dragon. Evacuation could not reverse the exposure already received, and contamination and its consequences became a long-term problem for the islanders.
We know about the energy and erroneous predictions from test program documents and later reports from the U.S. Department of Energy. The history of the fallout illustrates the limitation of a simple energy ranking: factors such as wind direction, test location, and the presence of people in the path of contamination are also significant.
Sources: www.energy.gov; ehss.energy.gov; www.energy.gov.
2nd Place: Tsar Bomba
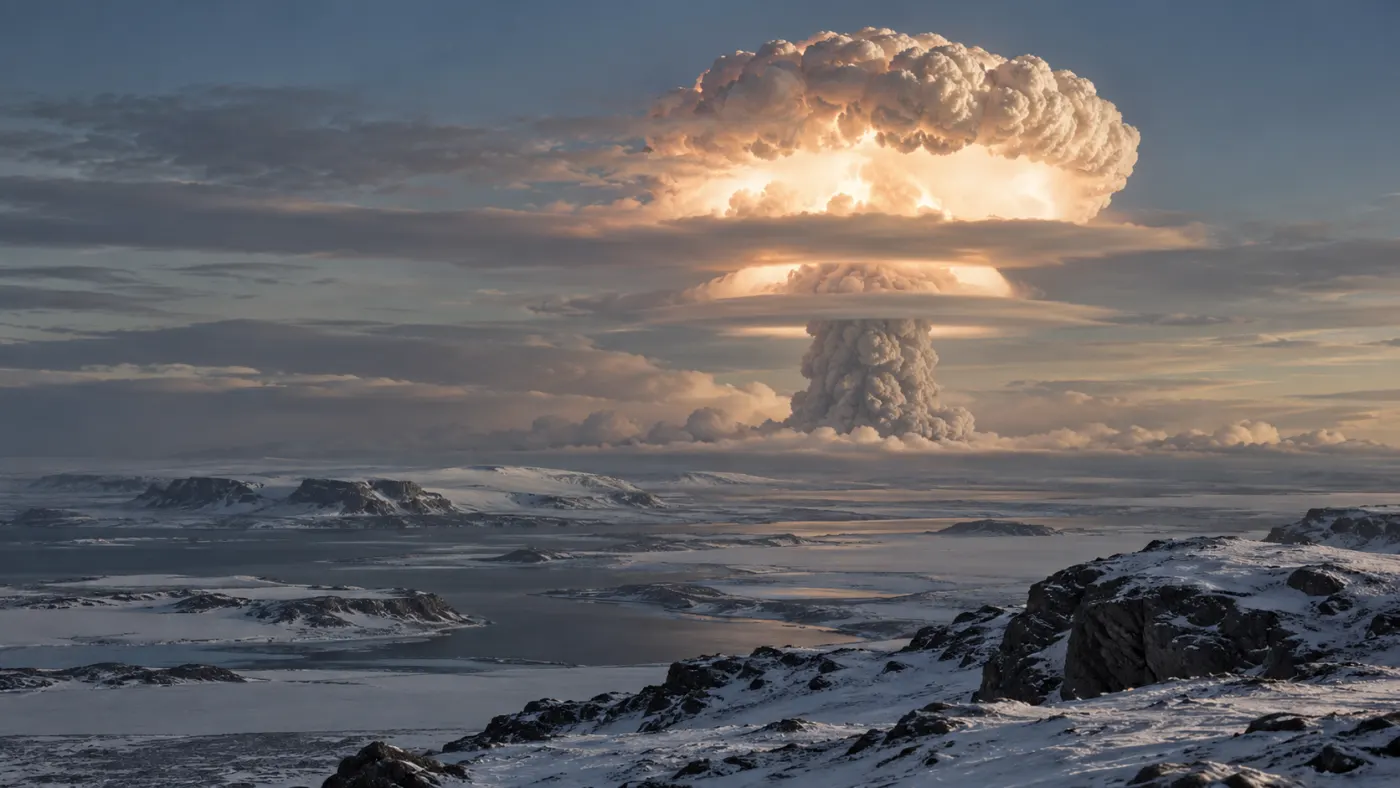
Date: 1961-10-30.
On October 30, 1961, the Soviet Union conducted an atmospheric test of a thermonuclear bomb over Novaya Zemlya. The device known as Tsar Bomba produced a massive flash and shockwave. The test took place at a test site, and its scale was part of the Cold War arms race.
The IAEA reports 50 Mt TNT as the energy of the explosion. This is about 3300 times more than the often cited 15 kt for Hiroshima, but the comparison concerns energy, not the number of casualties or destruction of a specific city. The height of the detonation and the surrounding environment are crucial for the effects.
Data on the test comes from historical documentation and records of waves detected far from the test site. CTBTO also cites published estimates of 50–57 Mt, indicating that different sources do not always provide the same value.
Sources: www-ns.iaea.org; conferences.ctbto.org.
1st Place: Chicxulub
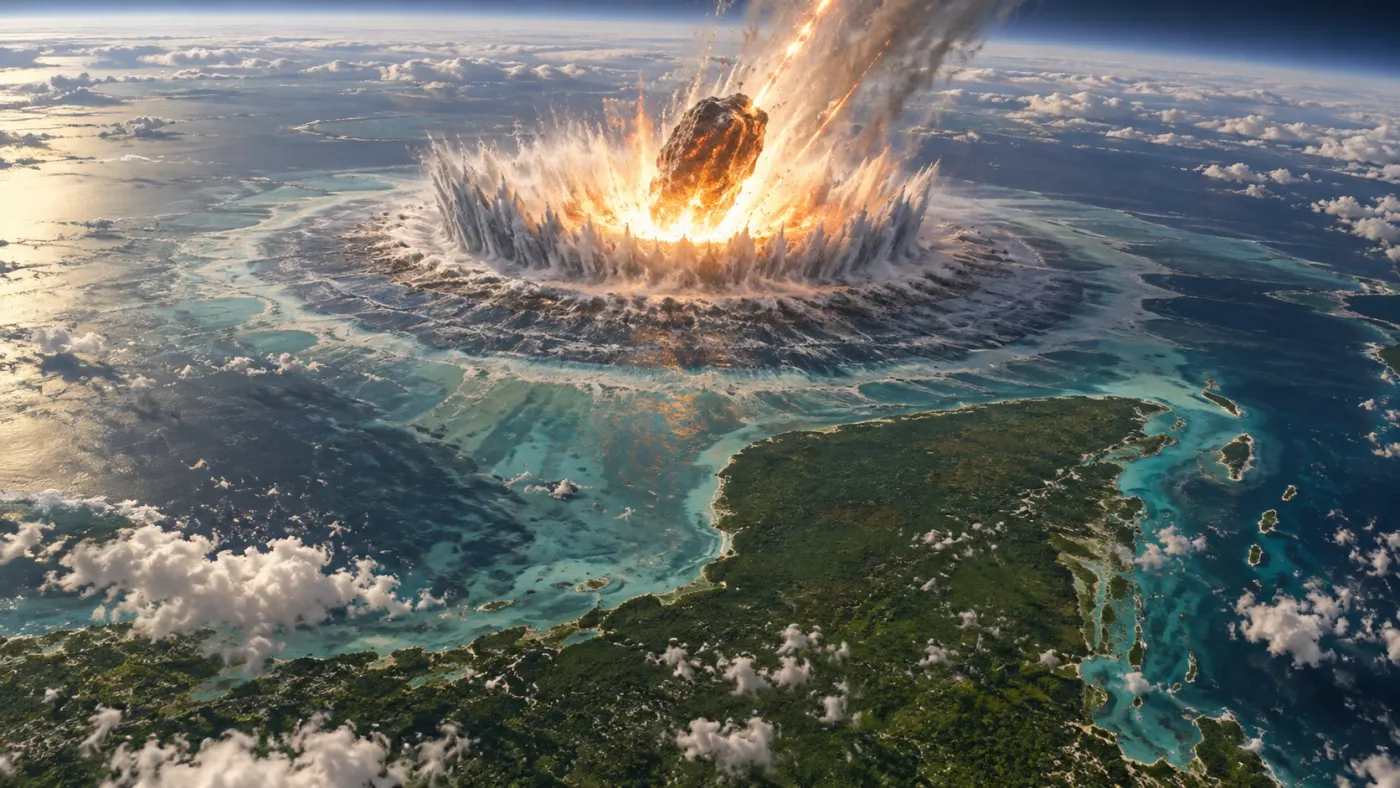
The model estimate of the impact energy is 400–4000 Tt TNT; the range is very wide. NASA NTRS.
Date: about 66 million years ago.
About 66 million years ago, a large celestial body struck the area of today's Yucatan Peninsula. A massive impact structure formed near the impact site; further, ejected and melted rocks settled. The impact is associated with a severe environmental crisis at the boundary of the Cretaceous and Paleogene periods, during which numerous groups of organisms, including non-avian dinosaurs, went extinct.
The history of the discovery began with an unusual layer rich in iridium in sediments from the boundary of the epochs. Geophysicists Glen Penfield and Antonio Camargo recognized the structure during oil exploration; it was only later that it was linked to the global boundary and impact hypothesis. This is an example where several independent traces provide a stronger argument than a single observation.
In the crater rocks, researchers found minerals altered by strong shock and traces of meteoritic material. Dating, geophysical measurements, and drilling help reconstruct the event. The size of the object, the exact energy, and the course of climate changes remain estimates dependent on the model.
Sources: science.nasa.gov; ntrs.nasa.gov.
Comments (0)
No comments yet. Be the first!